


Author of www.HotelLawBlog.com
11 June 2008
Hospitality lawyer with pearls from the New York hospitality conference. The mood in New York was more somber in June 2008 than it has been for a long time at hotel conferences. Final attendance was about 2400 (about the same as last year) and for the first time, NYU had fewer conference delegates than the Los Angeles conference in January (3,200 at ALIS in January 2008). Many believe that attendance at these conferences is a good barometer of sentiment in the industry — send more people when times are good, and send fewer when you batten down the hatches for a storm.
I had the opportunity to listen to Randy Smith and Mark Lomanno of Smith Travel Research in two sessions this past week — one private session at the Lodging Industry’s think tank (the Lodging Industry Investment Council or LIIC) and in the general opening session at NYU. My commentary includes selected slides from STR, and a link to the full STR presentation can be found at the end of the article. Here is a Hospitality Attorney’s executive summary.
PEARLS OF WISDOM
There were just too many pearls of wisdom gathered in New York for one blog. So to make them more digestible, we have broken them into segments as follows:
State of the U.S. Lodging Industry
What’s Weekday vs. Weekend demand tell us?
Whither Lodging Demand, GDP and the Cost of Gasoline?
Top Quips, Quotes and Insights from the 2008 NYU hotel conference
All these segments will be posted shortly, so check back if you don’t see the one you want.
It was only a few months ago that hotel industry pundits speculated that we were only in the 3rd or 4th inning of the good times for the hotel industry’s surge in growth and profits. Now, at least a few revel in predicting looming bankruptcies, receiverships and workouts.
Hotel Lawyer summary of the Smith Travel Research data presented at NYU Hotel Conference
• The real rate and RevPAR growth excitement today is “international”
• The hospitality industry is going to be “fine” in the near term, slowing down to overall RevPAR growth of 3% for 2008 and 2.8% for 2009, and going up from there (the 2008 and 2009 numbers are not far under the 20-year average of 3.4% growth)• The results will be better than these averages for the “Growth Scales” (luxury, upper upscale, upscale and midscale without F&B), and worse for the “Mature Scales” (midscale with F&B and economy)
• There is still a very high correlation between changes in U.S. GDP and demand for hotel rooms (as measured by room nights sold)
• New supply is diminishing, and there is less cause for concern today about new supply than there was a year ago. This bodes well for profits as a recovery picks up in late 2009 or 2010
• The damaging practice of “discounting” to maintain market share (and its downward spiral) has NOT emerged. There is no indication that discounting is a successful strategy to maintain or improve profits
• Airline capacity and lift will have an impact on the industry, but Lomanno notes that airline prices were much higher in the 1970s and 1980s and Smith says that if airline prices go up, people will still drive or take the train
Please note that I have inserted selected slides from the STR presentation below, and the full STR slideshow is available with the link at the very end of this article.
CHAIN SCALES
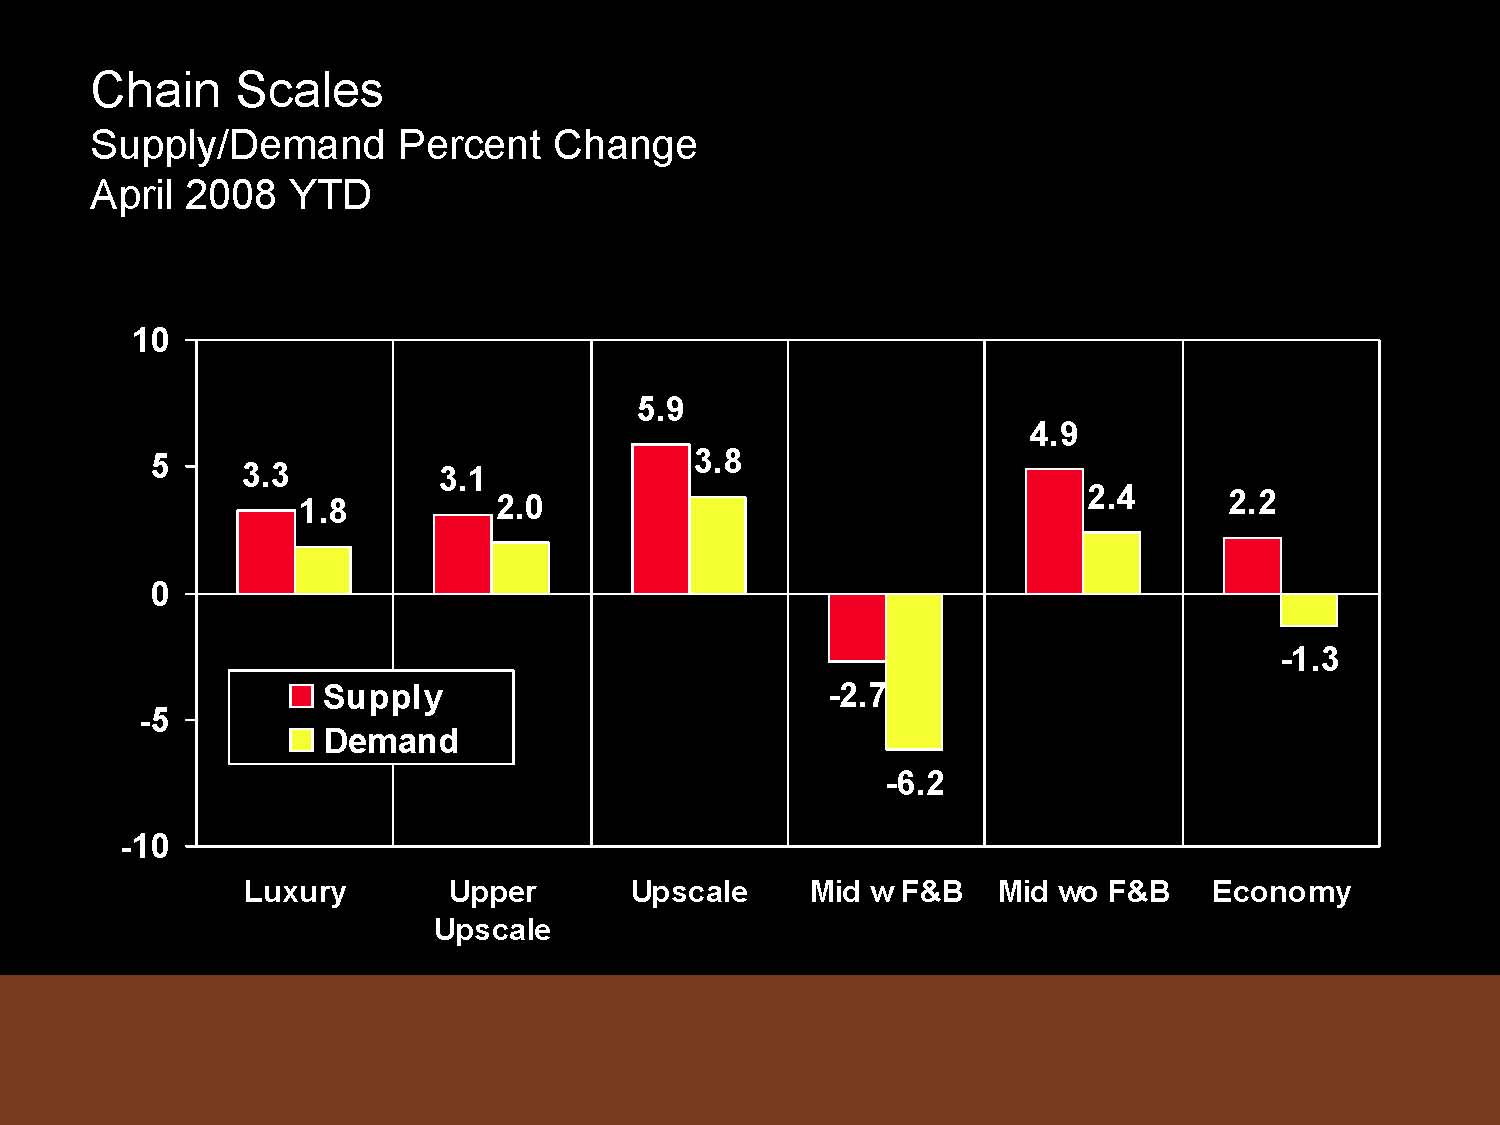
The data from Smith Travel Research on Chain Scales is interesting for two reasons. The first is the information conveyed about each of the 6 market segments (luxury, upper upscale, upscale, midscale with F&B, midscale without F&B, and economy) as to supply, demand, occupancy rate, and RevPAR for that segment.
But the other interesting thing is the dramatic paradigm shift of hotel rooms into 4 of these market segments, which have become the “haves” of the hotel world leaving the others as “have nots.”
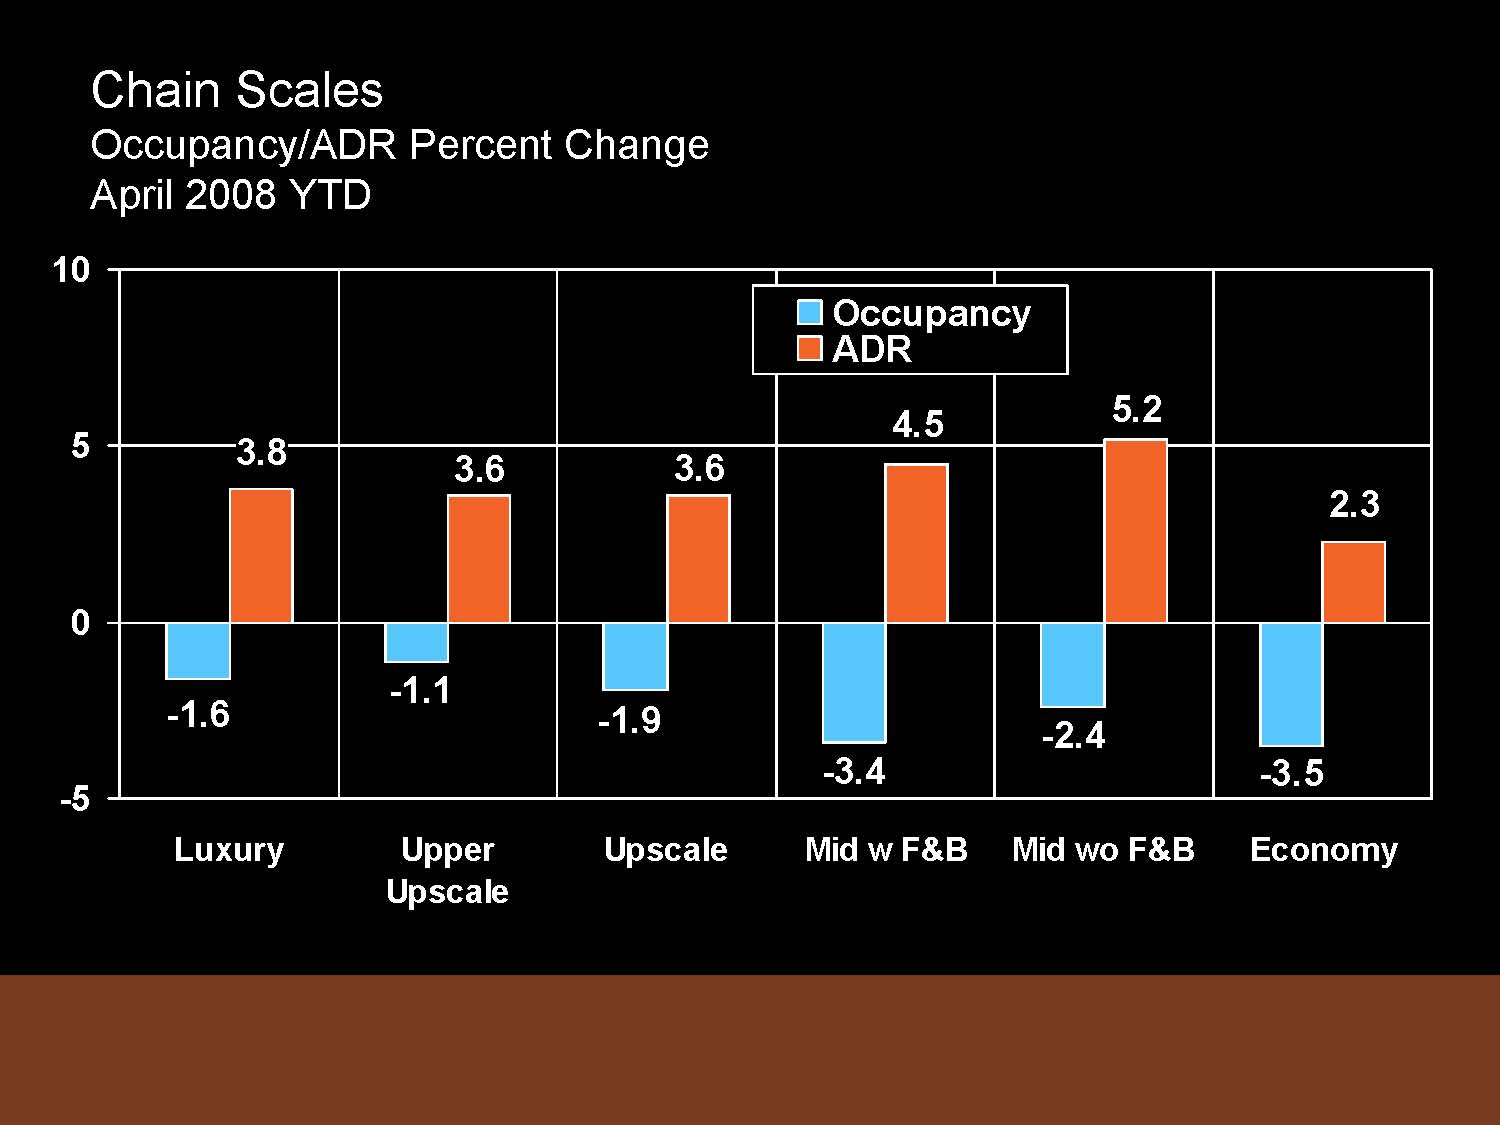
First, here is the STR data which show strong results for 4 segments, which STR calls the GROWTH SCALES. This is important, so pay attention. The Growth Scales are Luxury, Upper Upscale, Upscale and Midscale without F&B. The remaining two segments (midscale with F&B and economy are the “Mature Scales”). Here are the numbers on Supply/Demand and Occupancy/ADR changes:
Second, one of the most important and impressive changes illustrated below is how the Growth Scales have done compared to the Mature Scales. Mark Lomanno notes that 20 years ago, today’s Growth Scales accounted for 20% of the rooms in the hospitality industry. Ten years ago, they were 21.1% of the supply. But today, they represent 40% of the room supply.
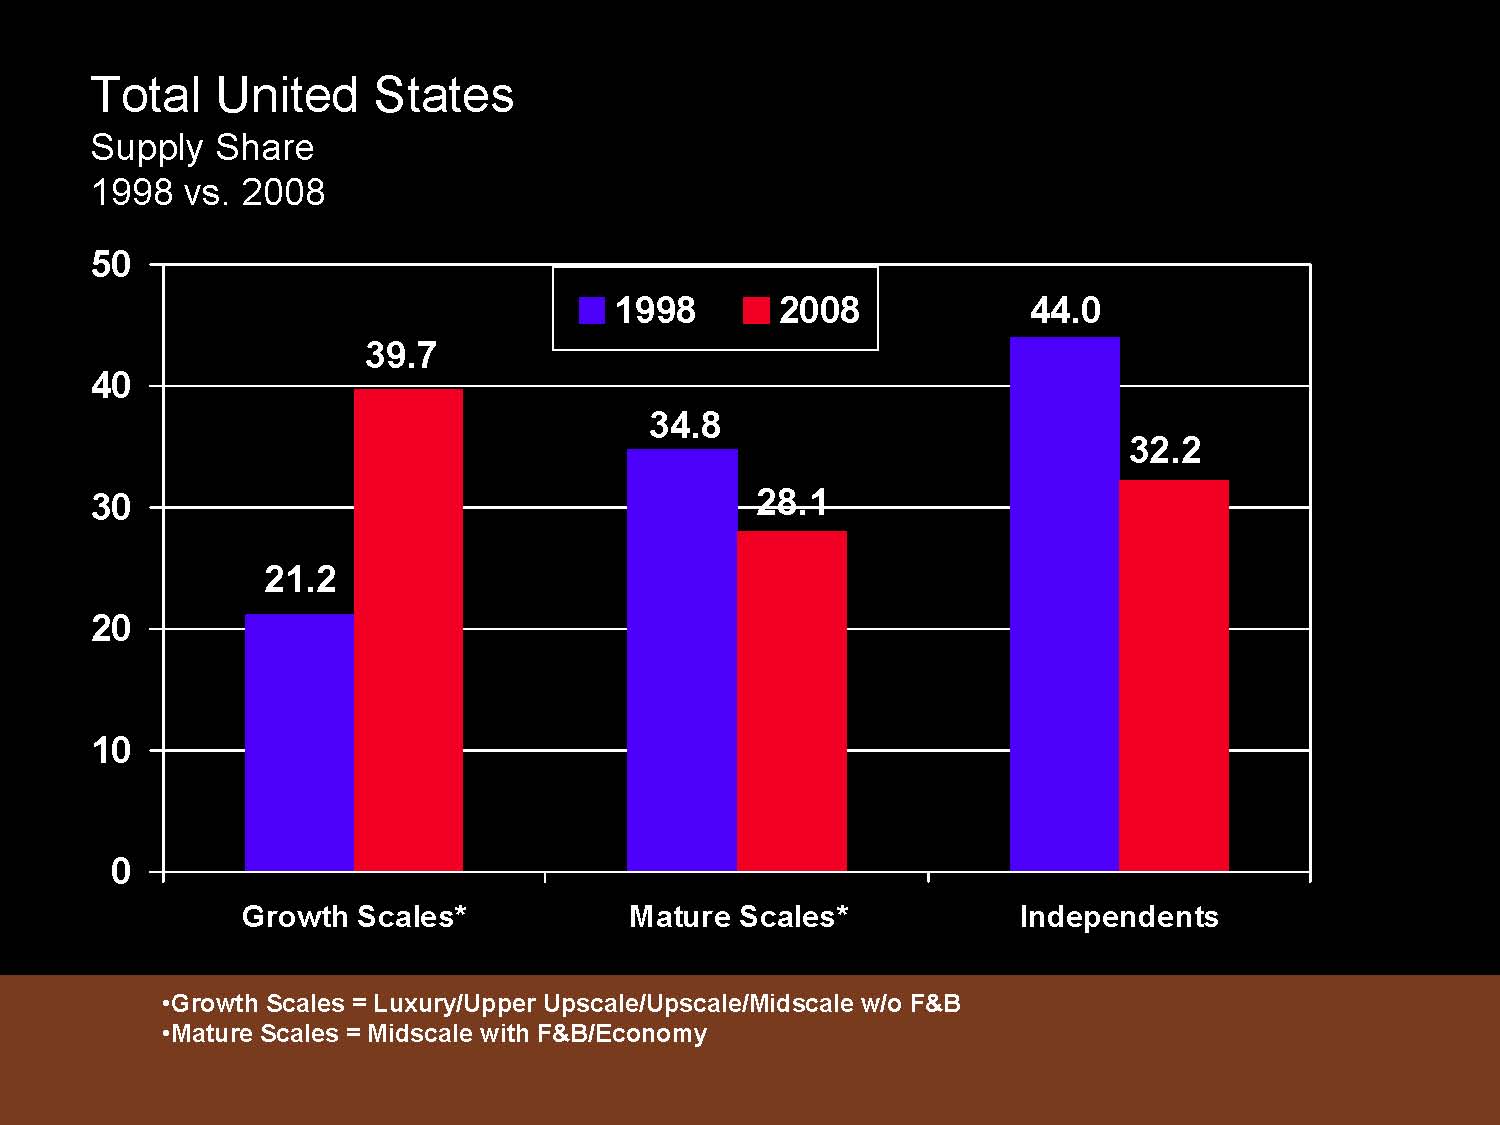
Today, these are favored segments because they also represent approximately 53% of the demand. This is where all the growth in the industry is taking place.
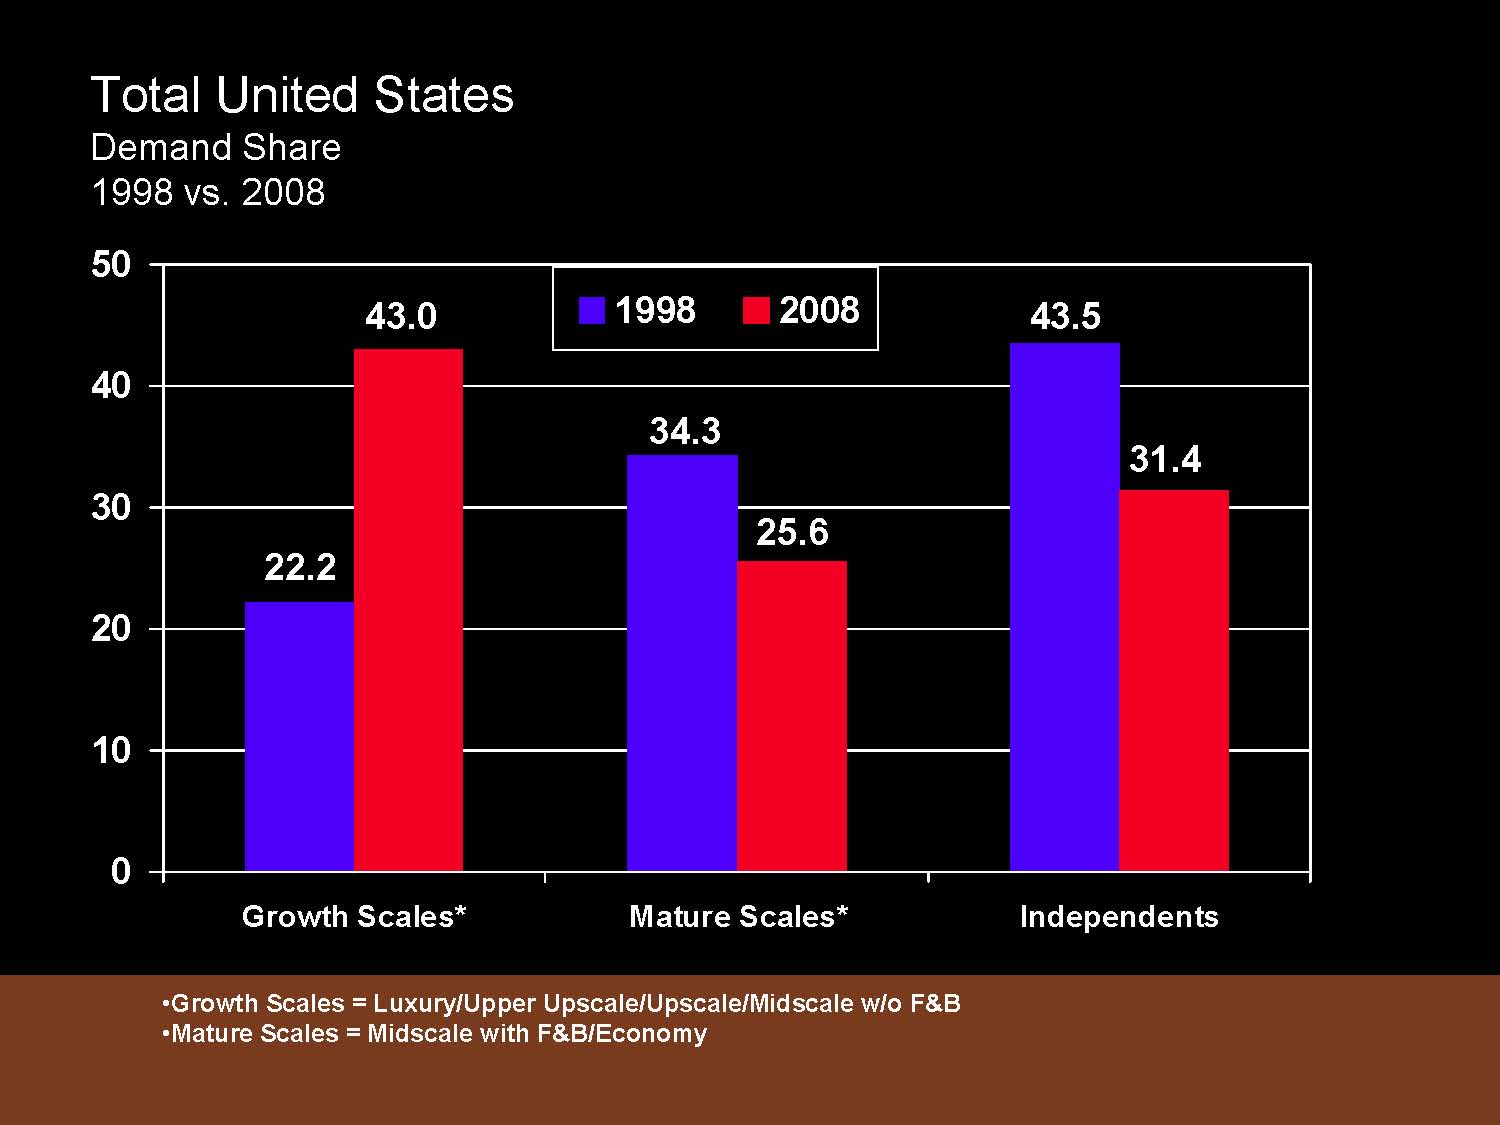
The revenue share also tells a story where the Growth Scales and Independents are stealing the show.

Lomanno’s conclusion? The Growth Scales will fare disproportionately better in any downturn or upturn! (He says that this should not be surprising, because the most cost conscious are the people who are ground zero of the subprime crisis, and they are most likely to use the Mature Scales — economy and midscale with F&B — so their cutbacks will hit these segments heavily.) Lomanno expects the Growth Scales will soon have 60-65% of the supply!
So where do you want to be? Or how can you change your positioning to get there?
Link to STR’s full slide show at NYU Hotel Investment Conference 2008.
My take on the data is above. Here is the link to the full unadorned slide show as presented by Randy Smith of Smith Travel Research on June 2, 2008. STR 2008 Data.
This is Jim Butler, author of www.HotelLawBlog.com and hotel lawyer, signing off. We’ve done more than $87 billion of hotel transactions and more than 100 hotel mixed-used deals in the last 5 years alone. Who’s your hotel lawyer?
________________________
Our Perspective. We represent developers, owners and lenders. We have helped our clients as business and legal advisors on more than $125 billion of hotel transactions, involving more than 4,700 properties all over the world. For more information, please contact Jim Butler at jbutler@jmbm.com or 310.201.3526.
Jim Butler is one of the top hospitality attorneys in the world. GOOGLE “hotel lawyer” or “hotel mixed-use” or “condo hotel lawyer” and you will see why.
Jim devotes 100% of his practice to hospitality, representing hotel owners, developers and lenders. Jim leads JMBM’s Global Hospitality Group® — a team of 50 seasoned professionals with more than $87 billion of hotel transactional experience, involving more than 3,900 properties located around the globe. In the last 5 years alone, Jim and his team have assisted clients with more than 100 hotel mixed-use projects — frequently integrated with energizing lifestyle elements.
Jim and his team are more than “just” great hotel lawyers. They are also hospitality consultants and business advisors. They are deal makers. They can help find the right operator or capital provider. They know who to call and how to reach them.
Jim is frequently quoted as an expert on hotel issues by national and industry publications such as The New York Times, The Wall Street Journal, Los Angeles Times, Forbes, BusinessWeek, and Hotel Business. He is the Conference Chairman of The Hotel Developers Conference™ and Meet the Money®.
Contact him at jbutler@jmbm.com or 310.201.3526. For his views on current industry issues, visit www.HotelLawBlog.com.